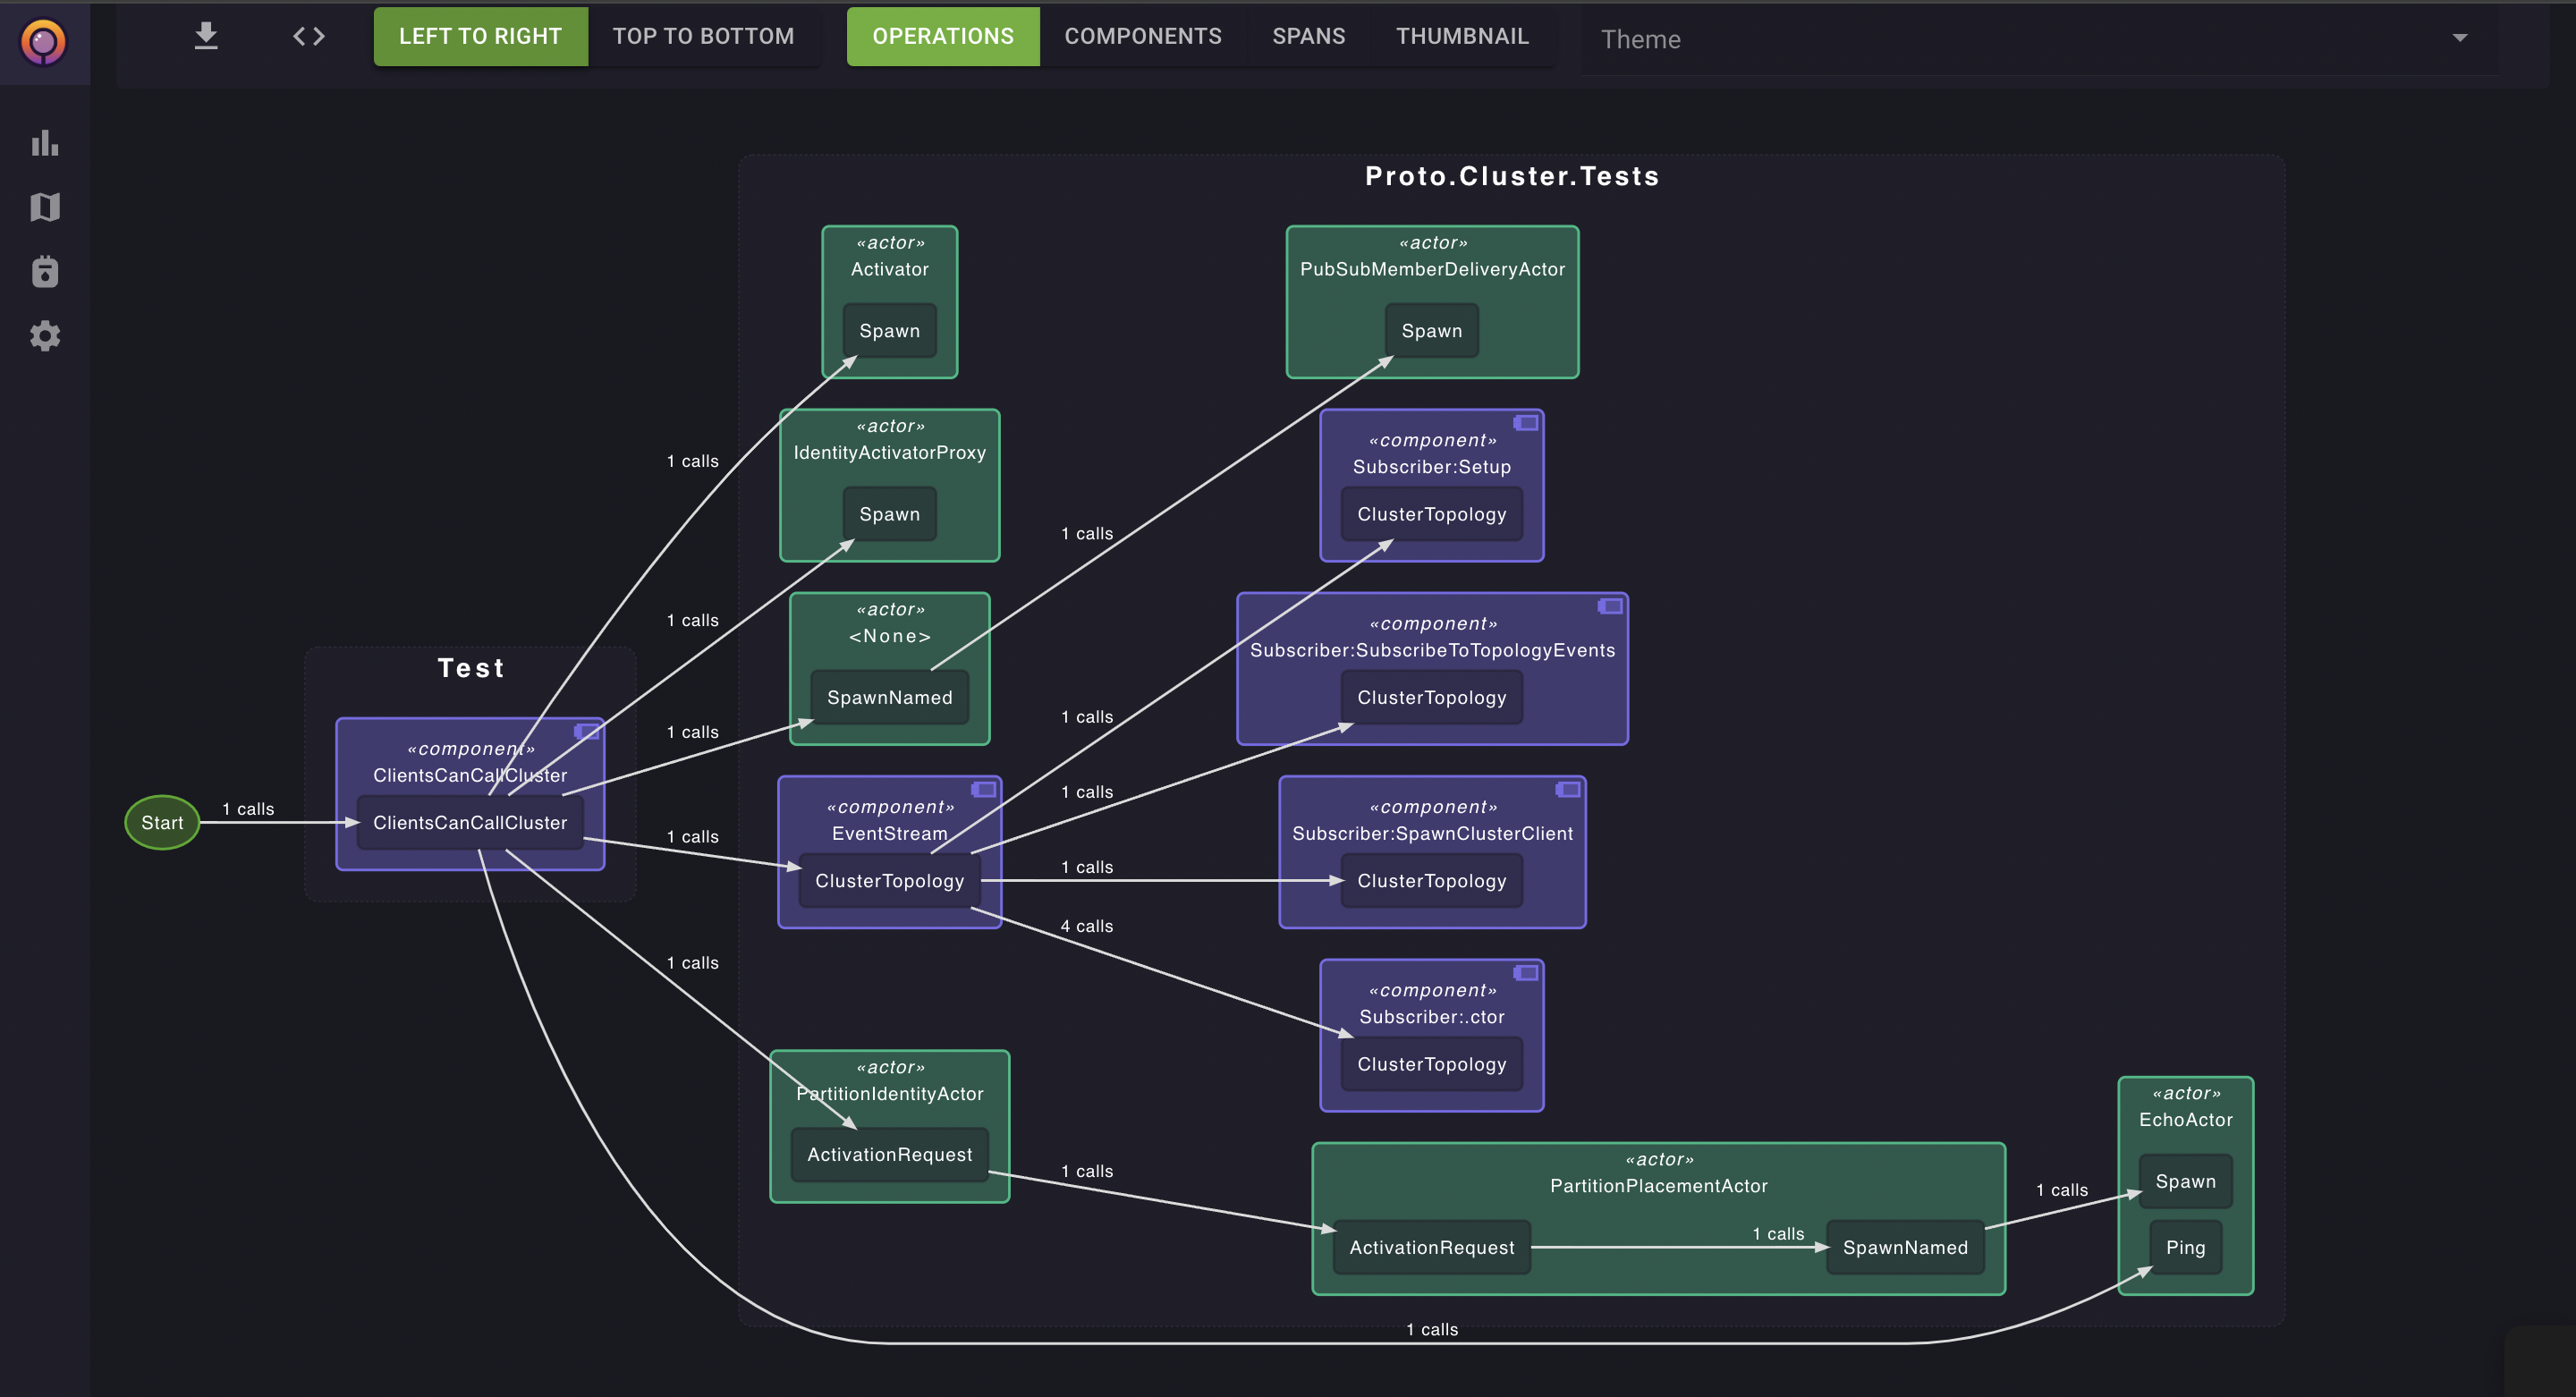
Component Diagrams
Introducing our visualization feature that transforms OpenTelemetry data into detailed component diagrams. Quickly understand system composition through precise visual representations generated from individual or aggregated trace data. Simplify complex architectures into actionable insights for efficient system management.
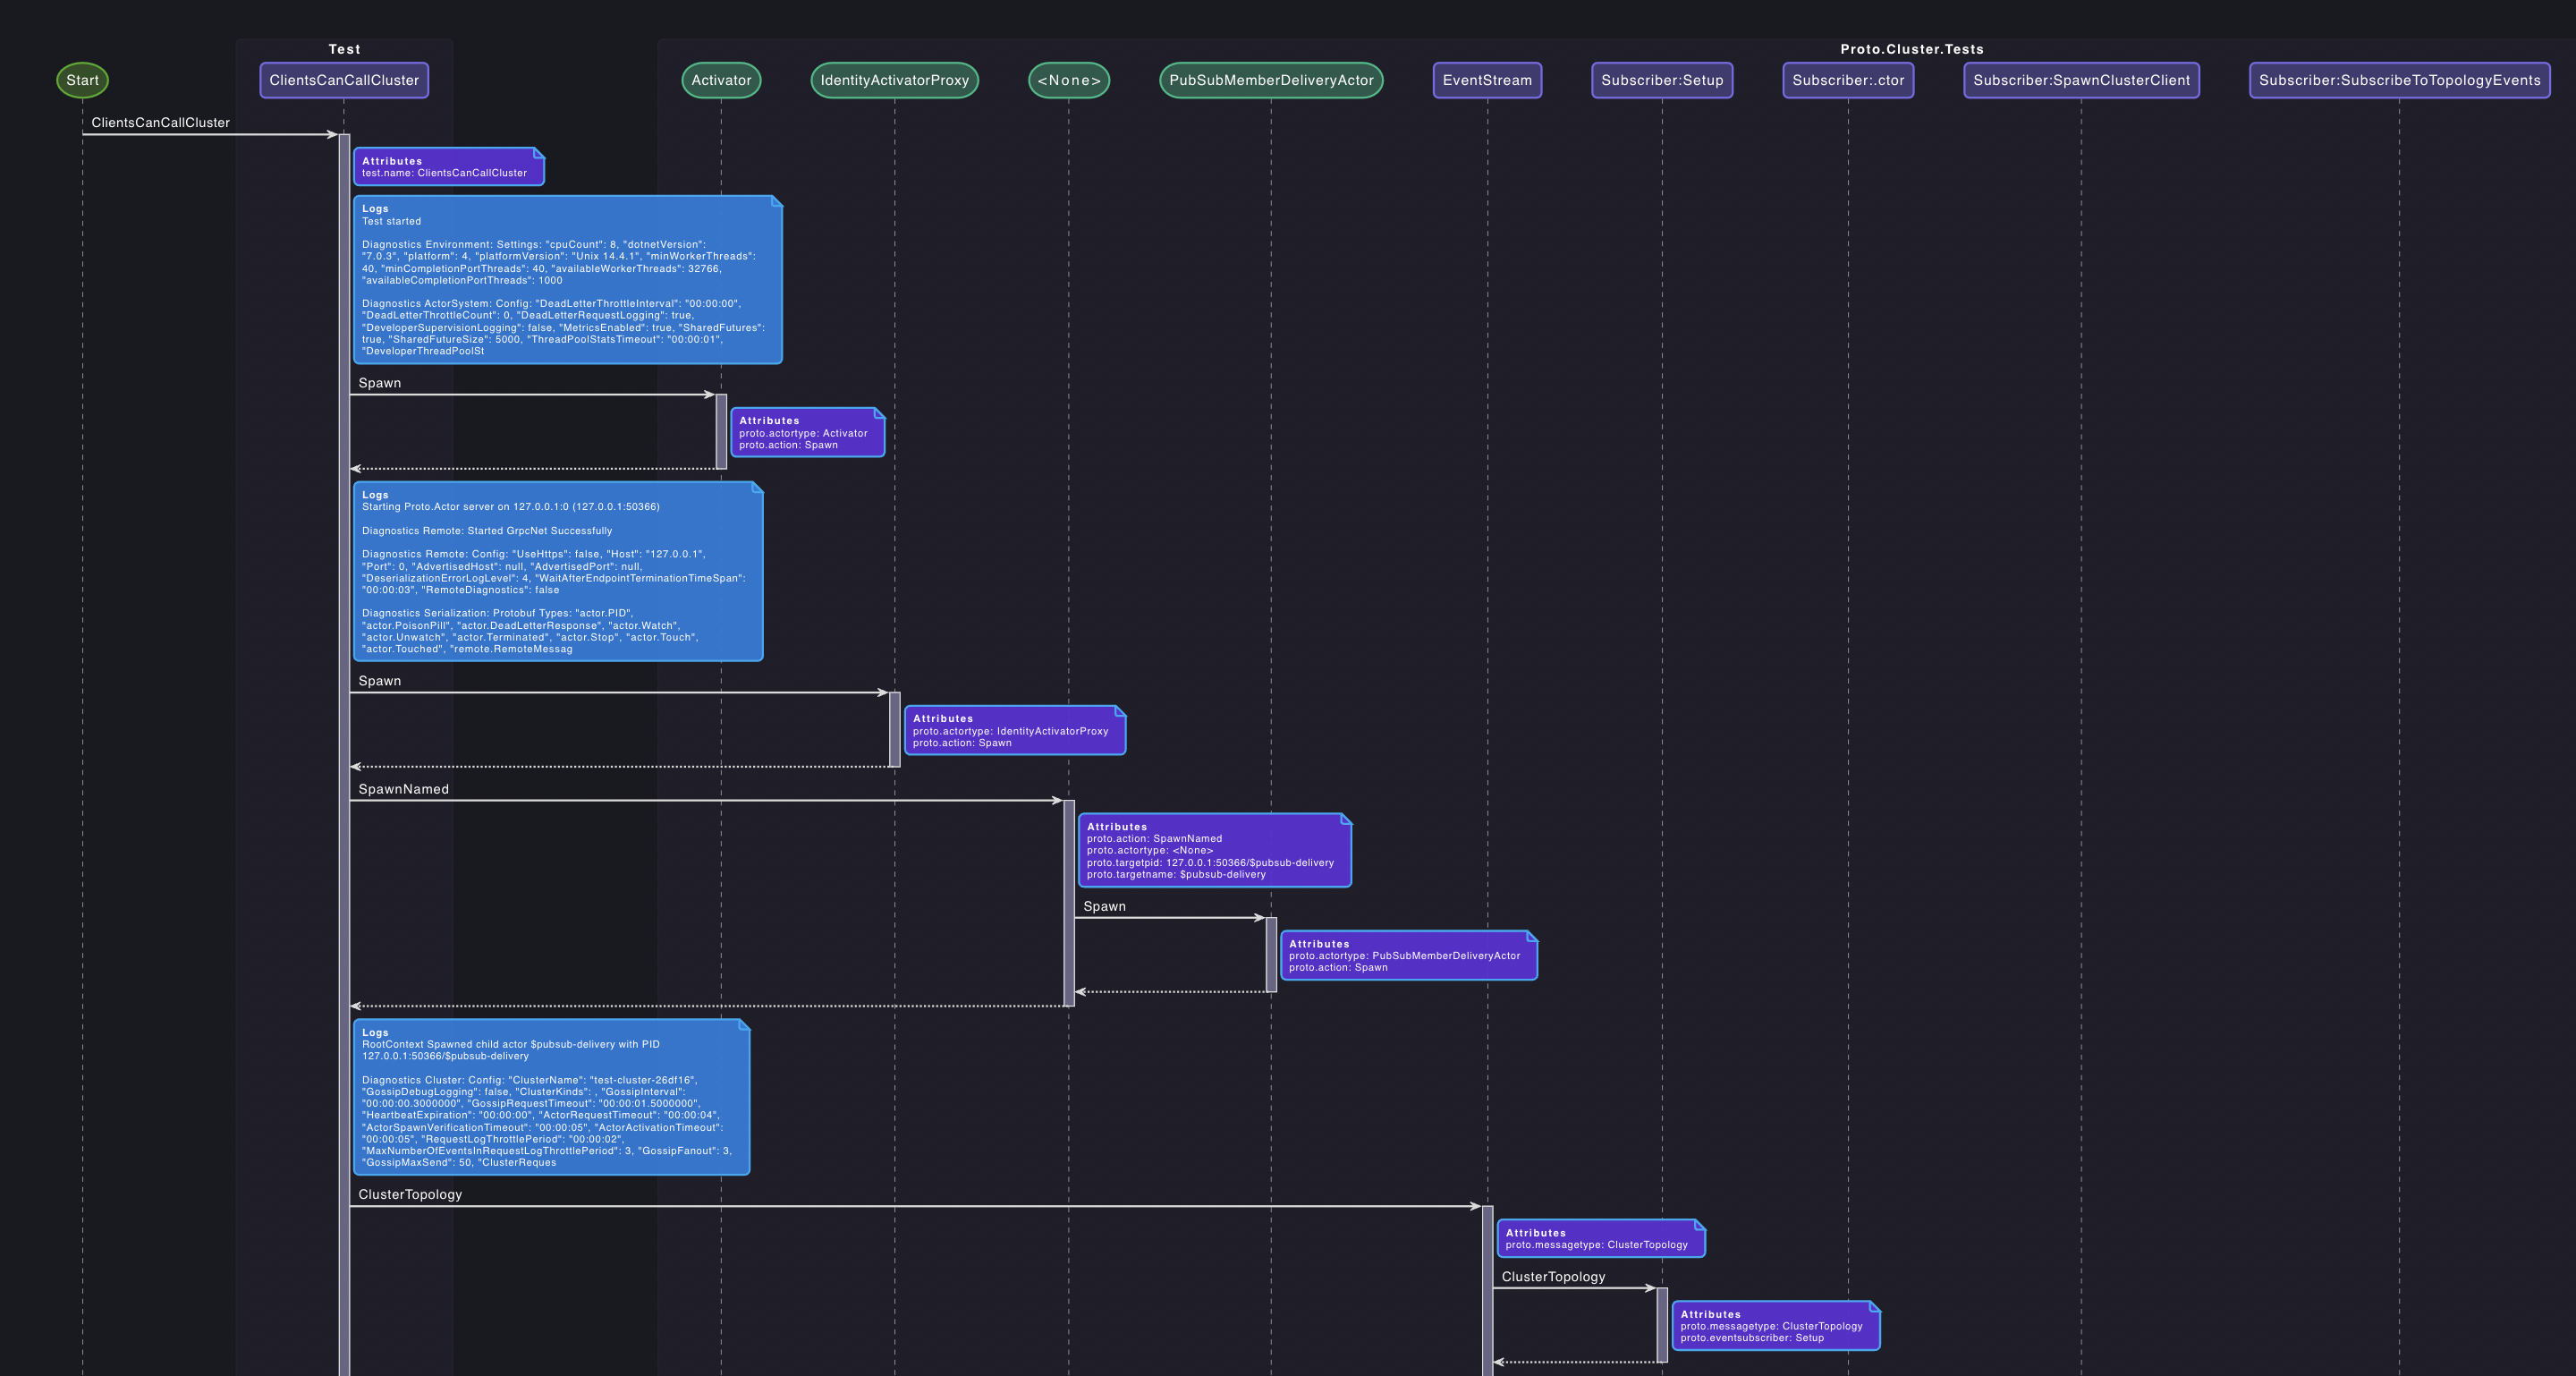
Sequence Diagrams
Discover our sequence diagram visualization tool, designed to render sequence diagrams from individual traces. Gain clear insights into the operational order within your system, seeing exactly how each process interacts step-by-step. This feature simplifies the complexity of trace data into intuitive diagrams, enhancing your ability to analyze and optimize system workflows efficiently.
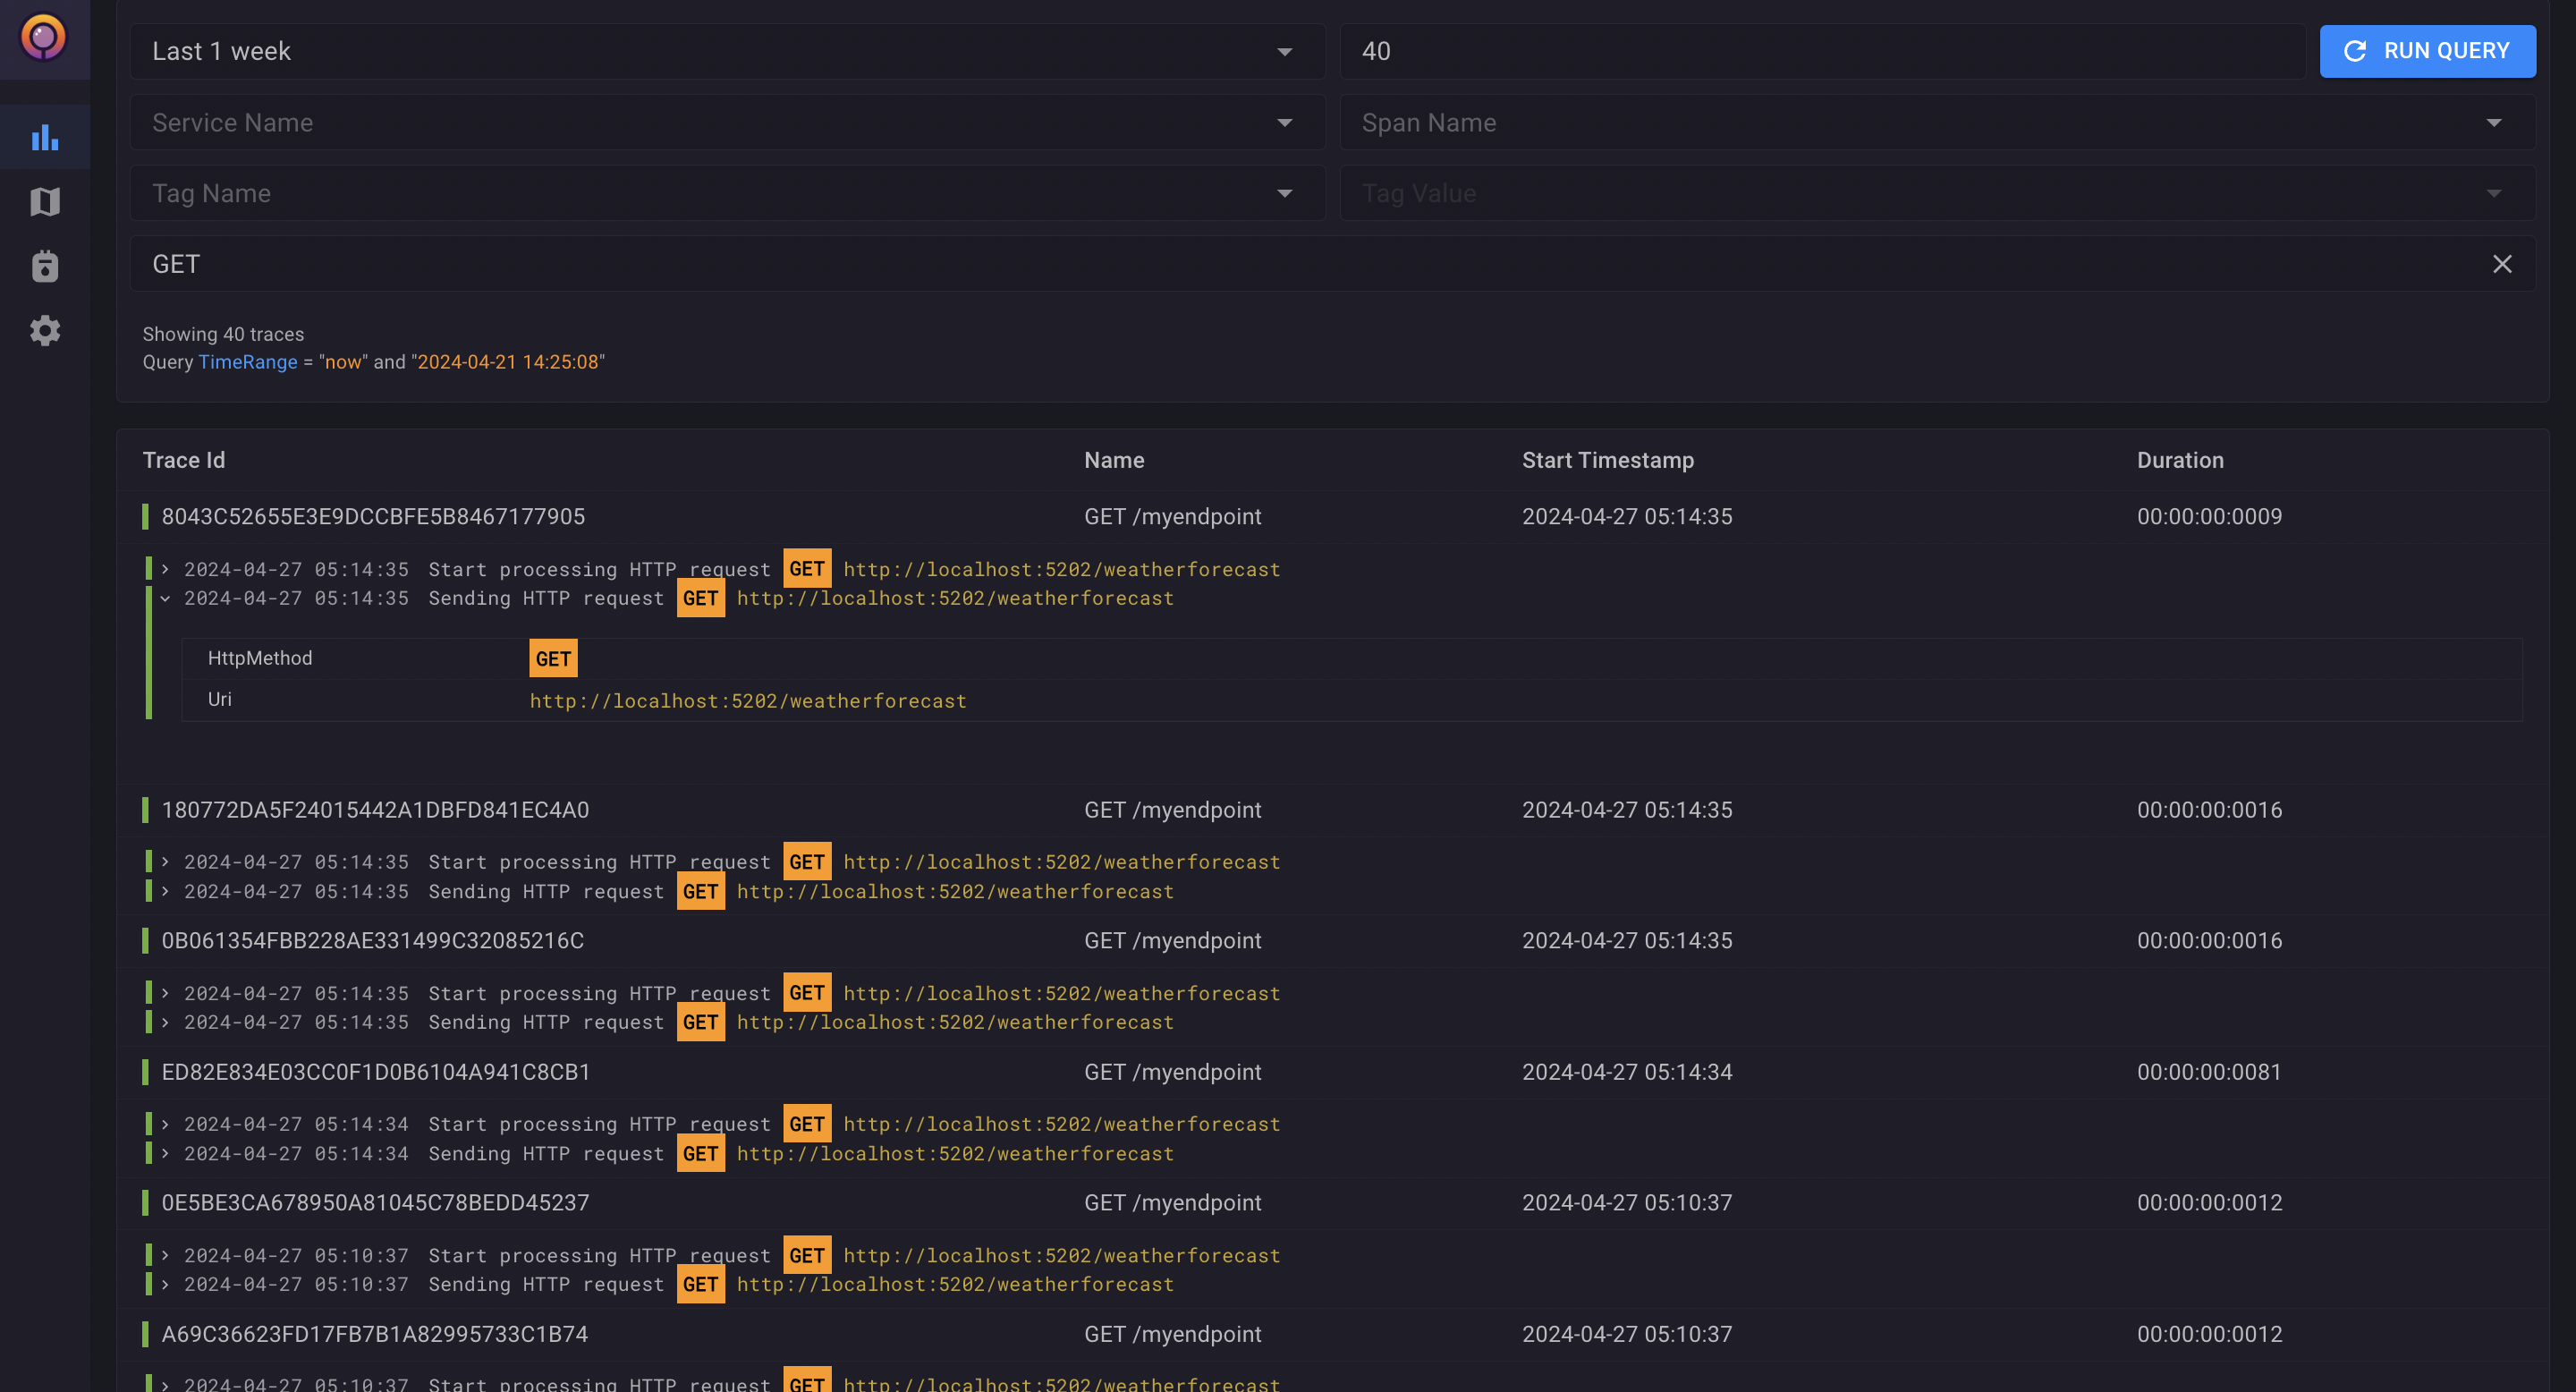
Trace and Log Search
Explore our log and trace search feature, designed for comprehensive searches across trace data and free-text logs. Utilize specific trace queries, broad textual searches, or a combination of both for flexible data exploration. Quickly pinpoint relevant details, streamline diagnostics, and enhance system monitoring with customizable search options.
Log View
Check out our log viewer tool, crafted to enhance your log reading experience. This feature not only allows you to search through logs but also to view and analyze metadata, including OpenTelemetry log attributes. Streamline your log analysis with powerful search capabilities and rich metadata insights, all in one intuitive interface
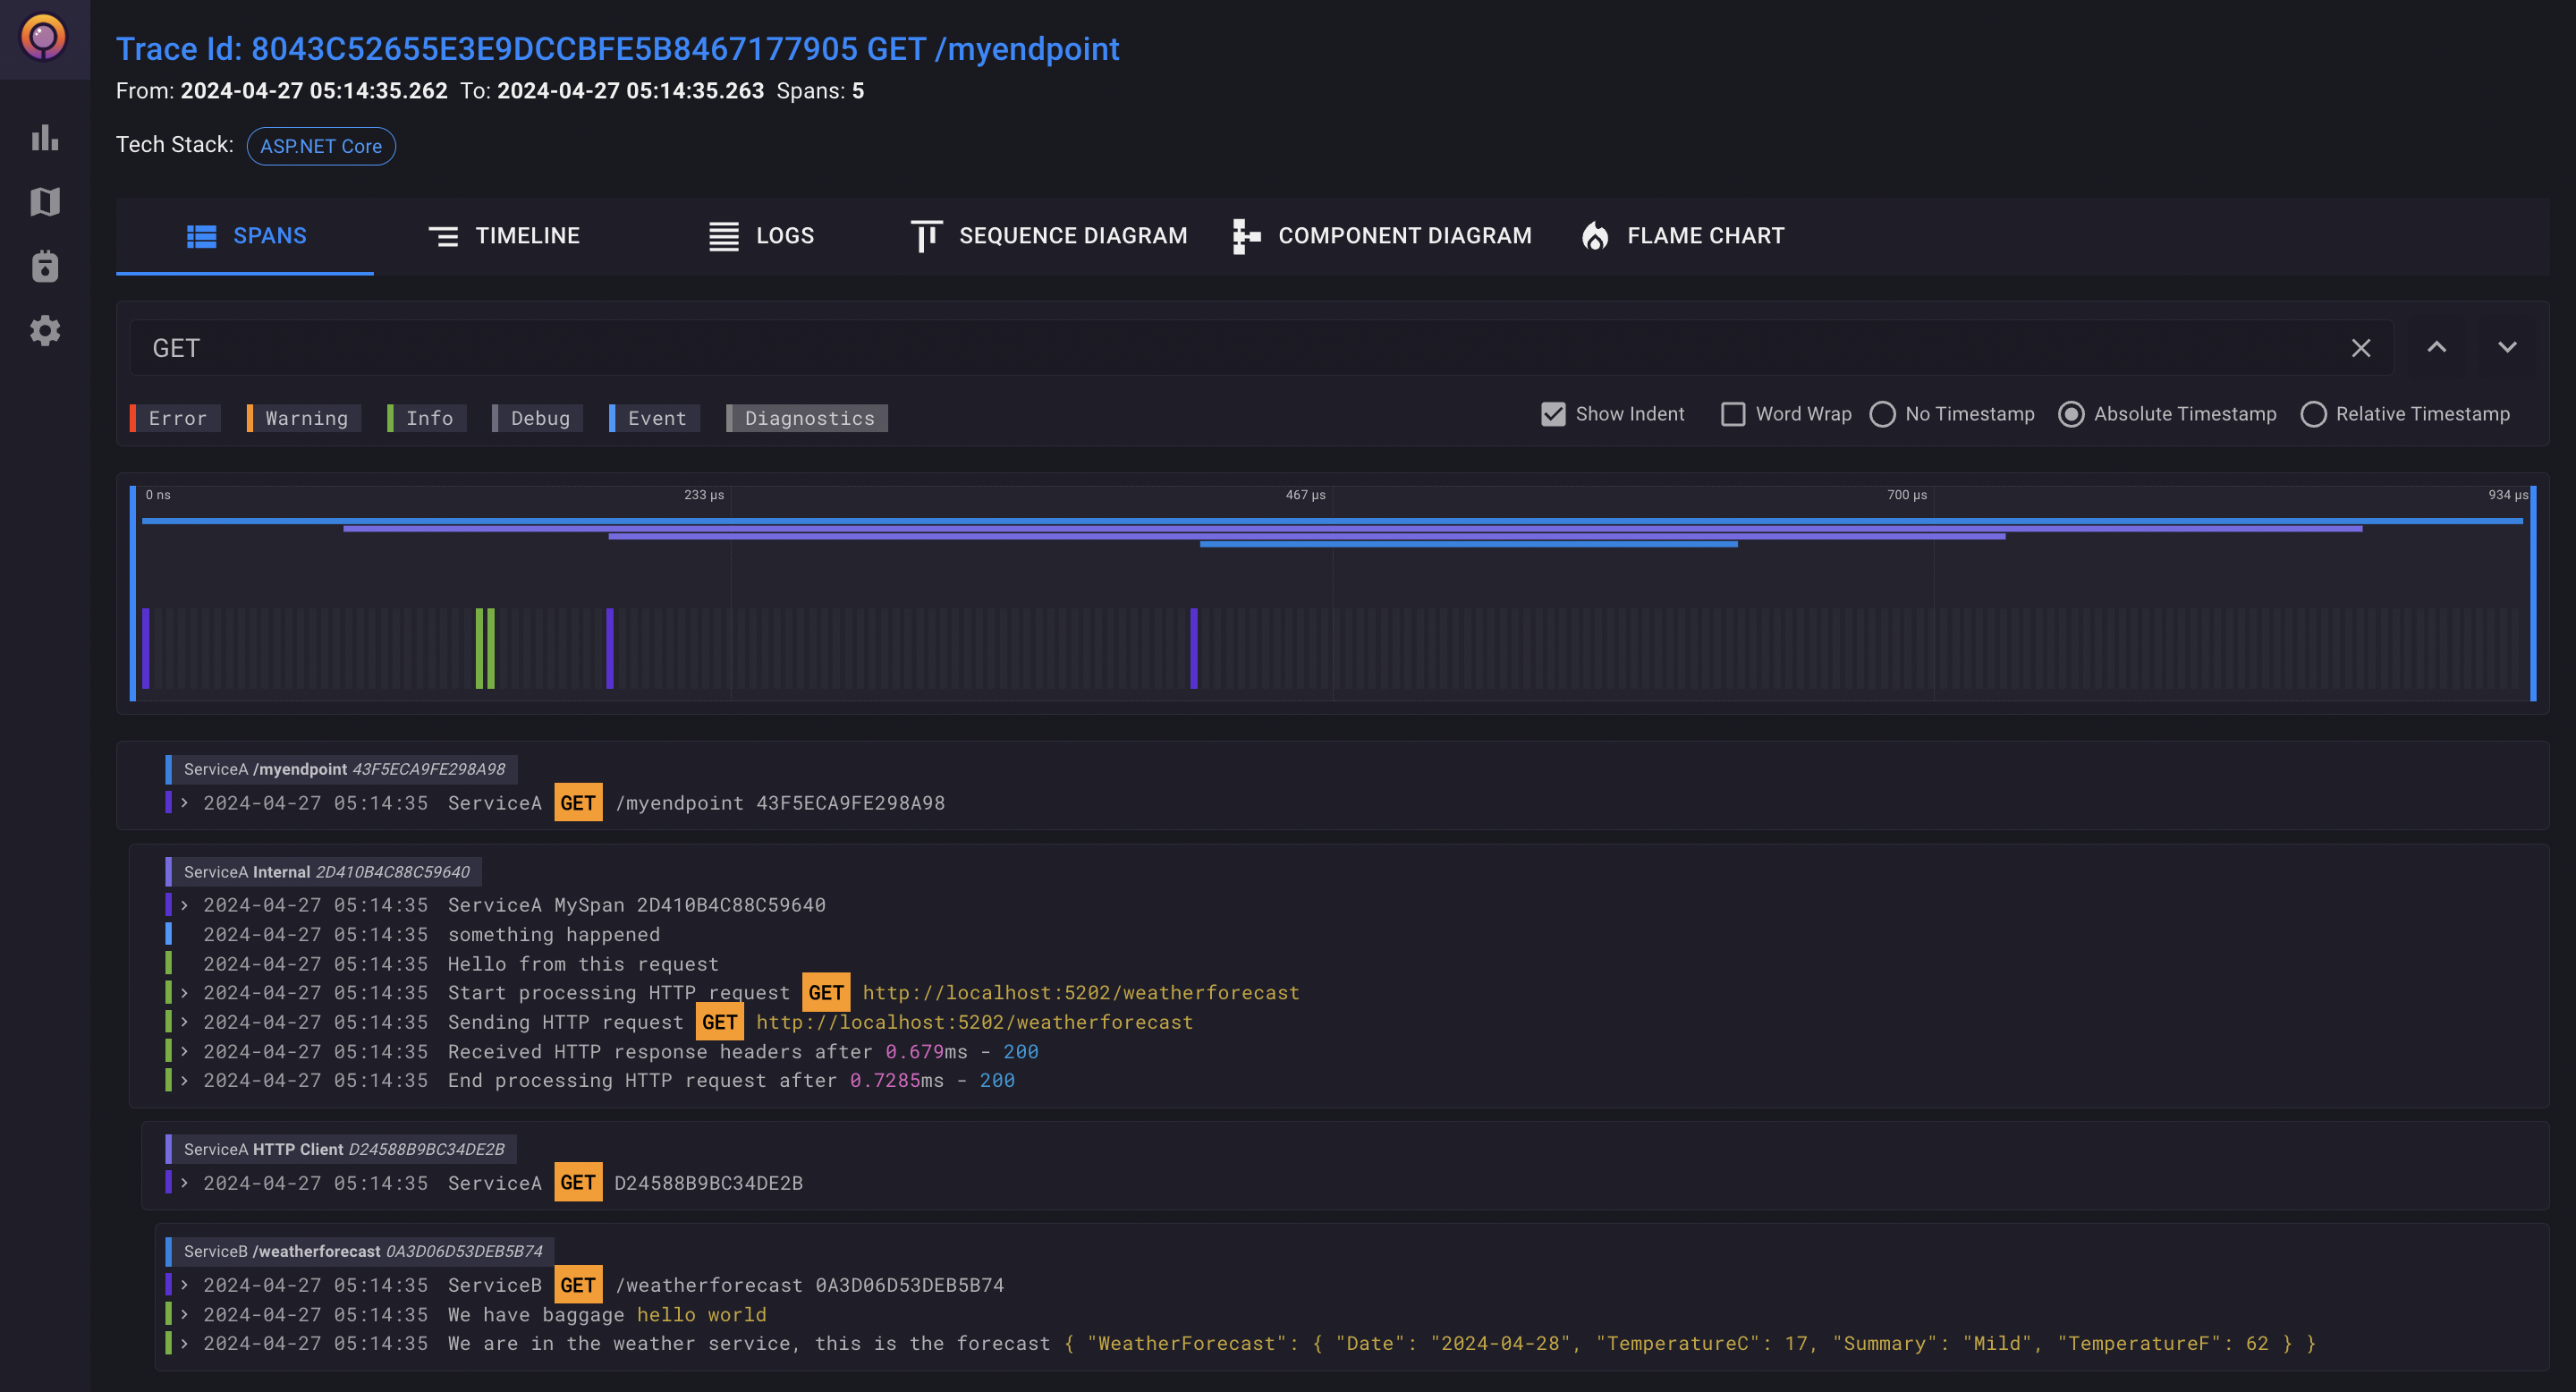
Trace View
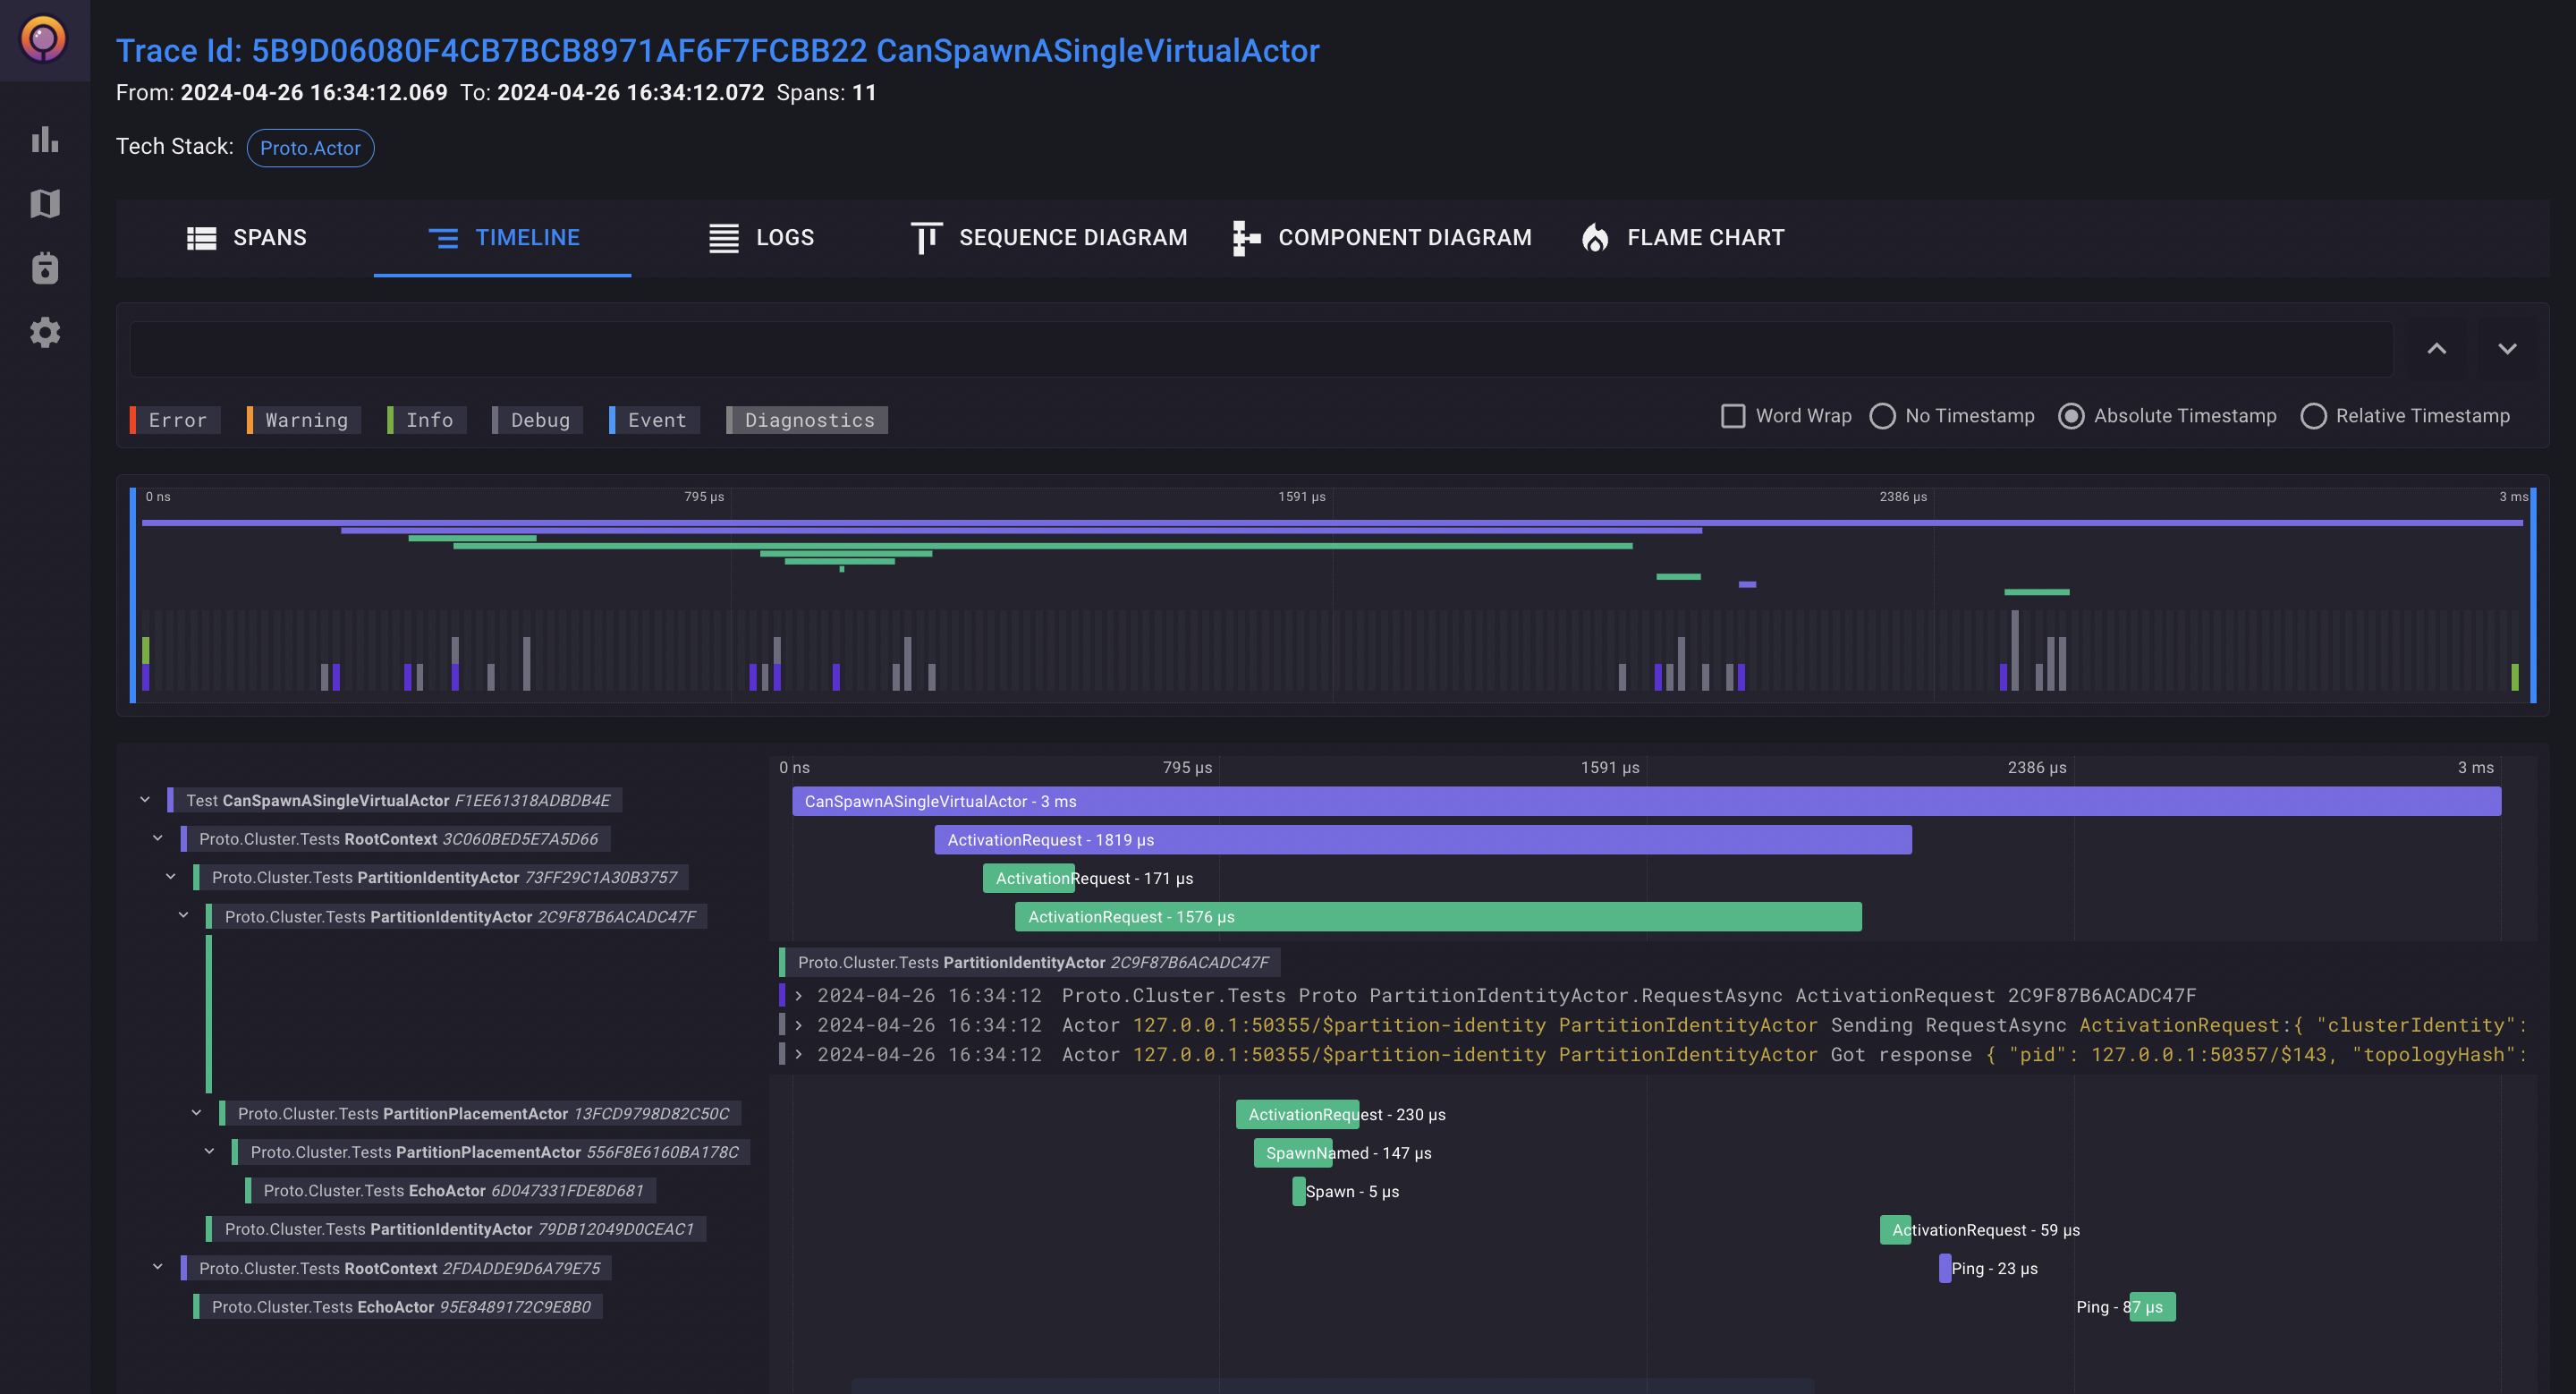
Introducing our distributed trace viewer, which seamlessly integrates log information within trace visualizations. This tool provides a comprehensive view of distributed system activities by inlining relevant log data directly into the trace diagrams. Enhance your trace analysis with detailed contextual insights, making it easier to understand and troubleshoot system behaviors in real-time.
Metrics View
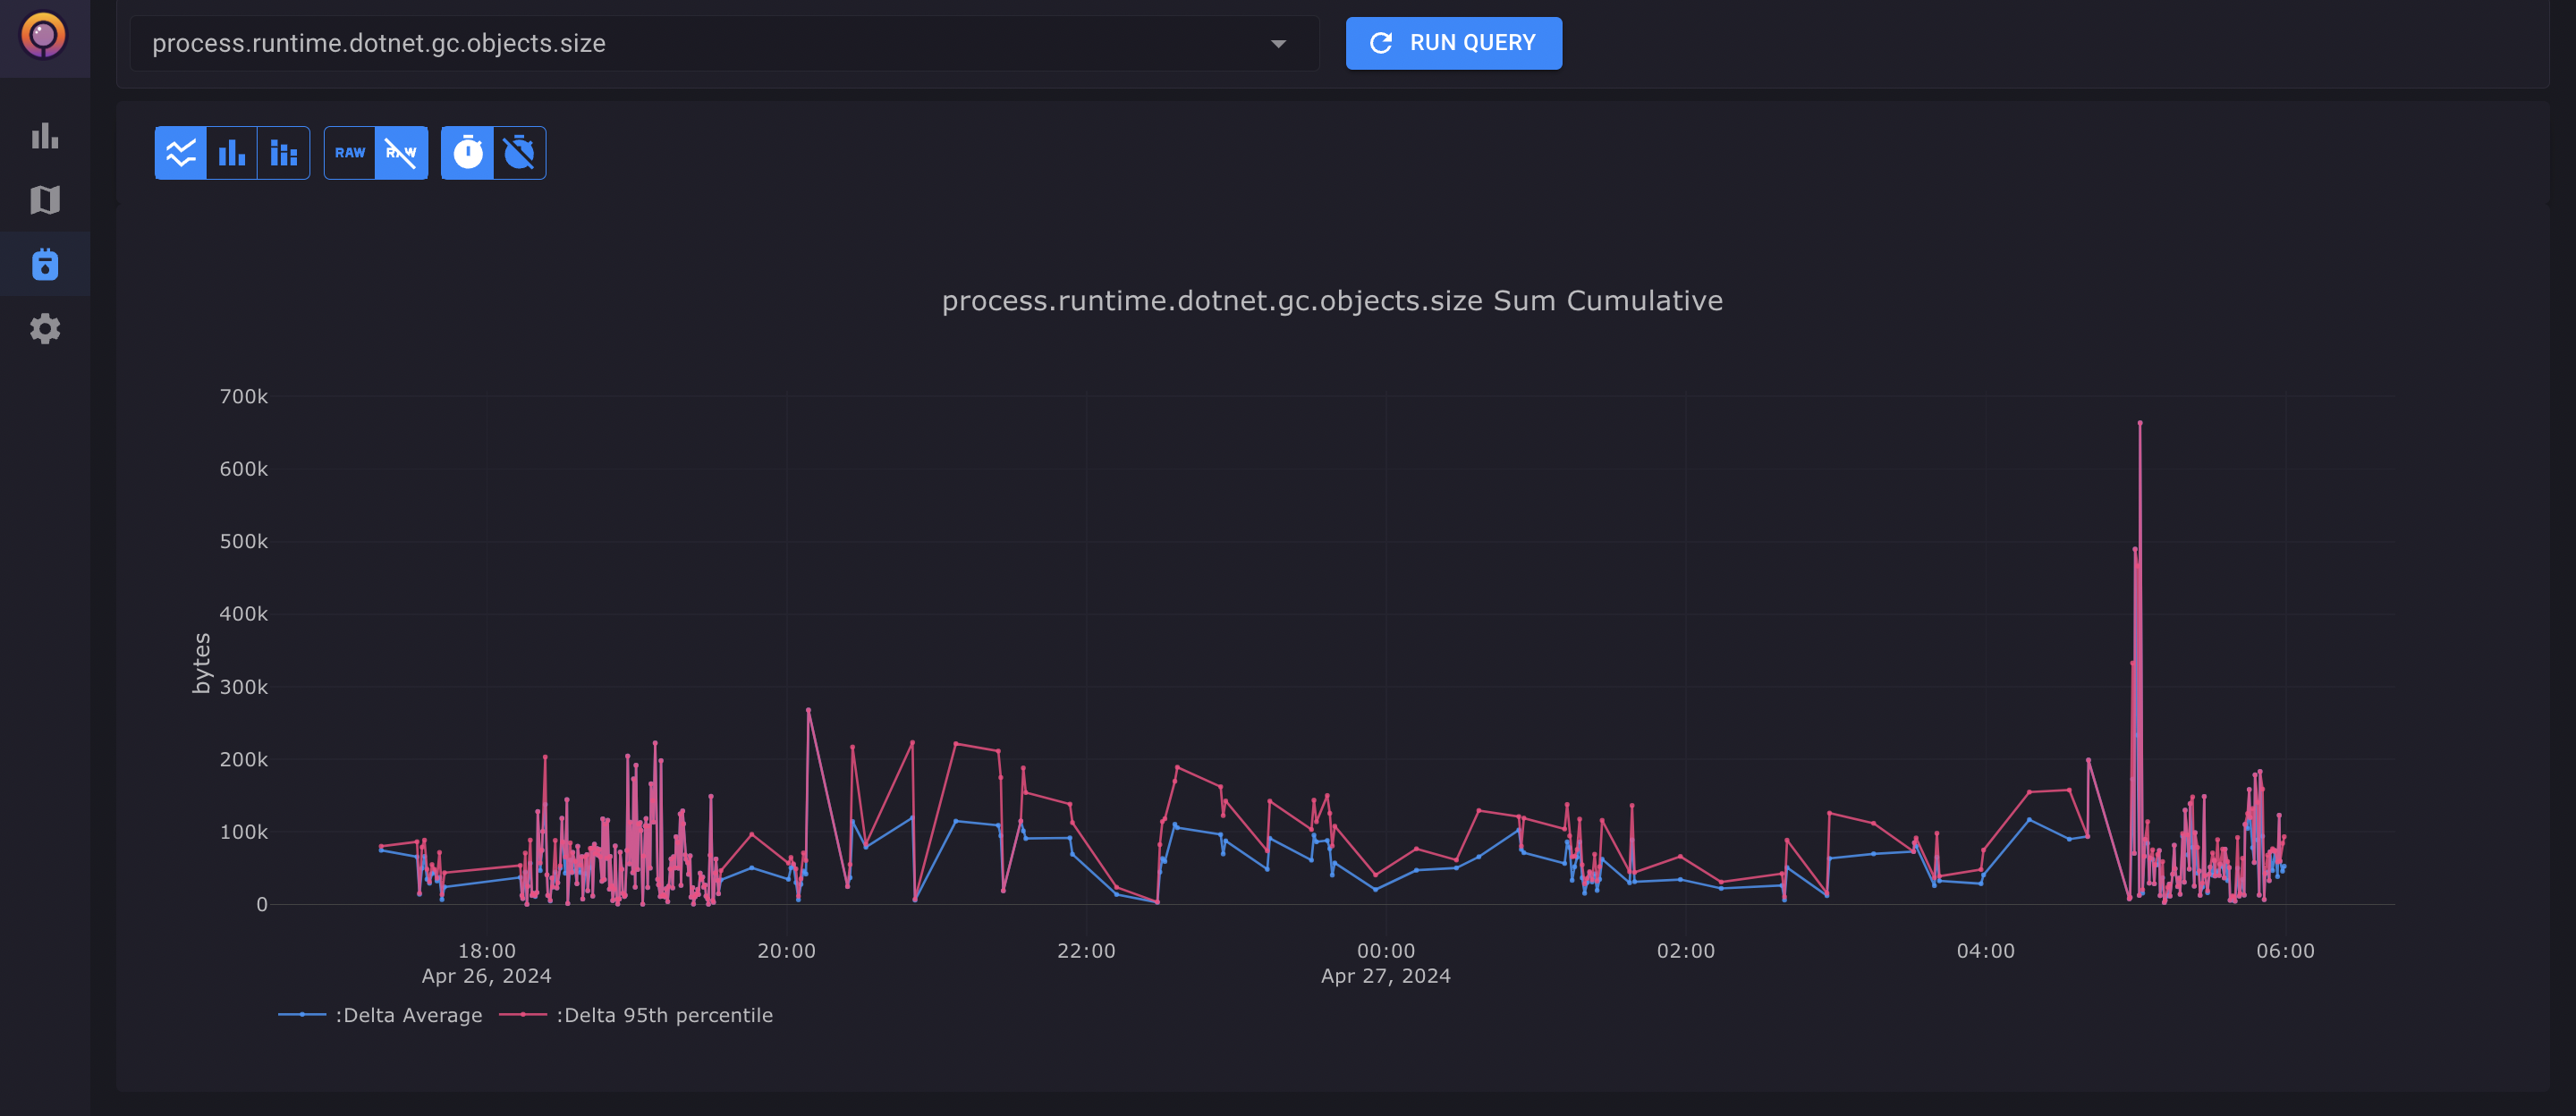
Discover our Metrics Explorer, designed for viewing raw metrics, aggregated data, or percentiles. This powerful tool allows you to customize your analysis, offering detailed insights into system performance. Understand and optimize your system's efficiency and health with tailored visualizations of key metrics.